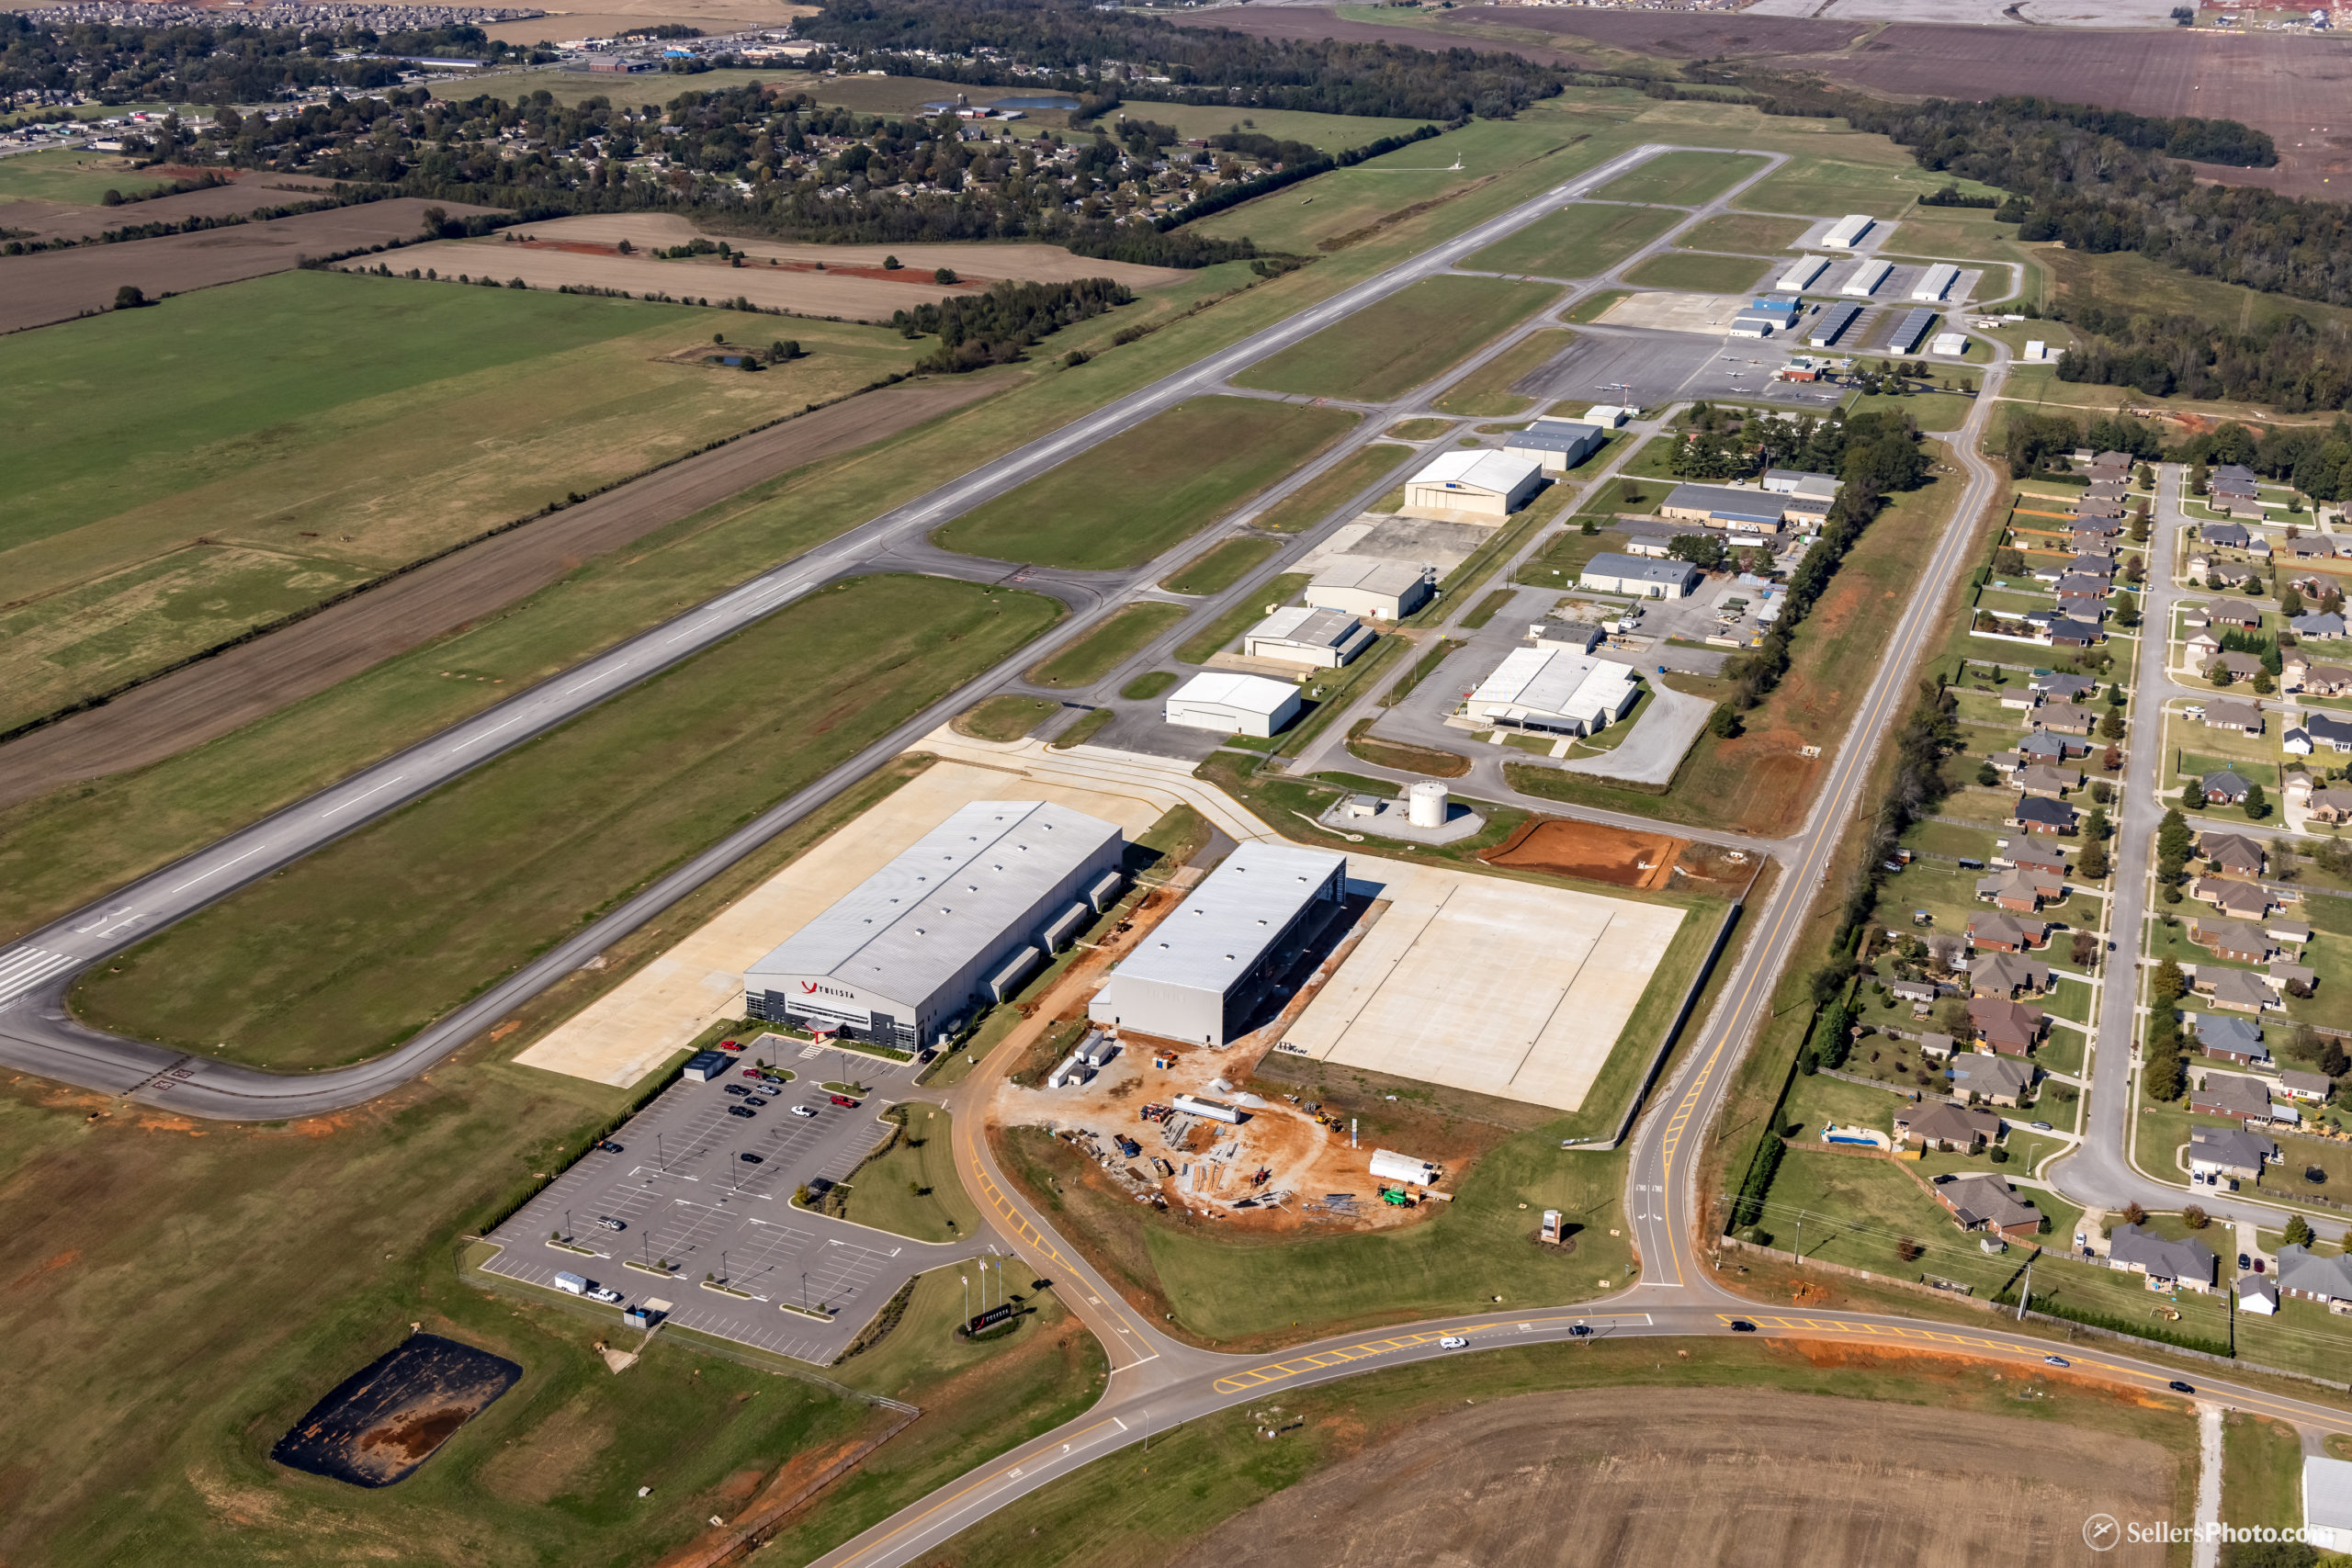
|
|
 |
|
Demographics - Madison County, Alabama
|
|
Total
Population - Madison County |
|
Year 2006
Projection |
293,658 |
|
Year 2001
Estimate |
279,699 |
|
Year 1990
Census |
238,912 |
|
Year 1980
Census |
196,966 |
|
Growth 1980 -
1990 |
21.30% |
|
Equifax
National Decision Systems - March 2001 |
|
2001
Demographic Profile
|
|
- |
Madison County |
City of Huntsville |
City of Madison |
|
Population |
281,931 |
153,141 |
27,218 |
|
Households |
111,978 |
63,793 |
11,303 |
|
Median Age |
35.47 |
35.96 |
34.18 |
|
Average
Household Income |
$57,276 |
$55,258 |
$74,824 |
|
Median
Household Income |
$60,600 |
$41,323 |
$63,445 |
|
Per Capita
Income |
$23,211 |
$23,398 |
$31,341 |
|
2001 Estimated
Population By Race |
|
White |
72.85% |
|
Black |
23.19% |
|
Asian &
Pacific Islander |
2.14% |
|
Other |
1.81% |
|
2001 Estimated
Population By Age |
|
Age 0 to 14 |
20.27% |
|
Age 15 to 20 |
8.53% |
|
Age 21 to 29 |
13.02% |
|
Age 30 to 39 |
15.02% |
|
Age 40 to 49 |
15.59% |
|
Age 50 to 59 |
12.87% |
|
Age 60 and
Above |
14.69% |
|
Median Age |
35.47 |
|
Average Age |
36.08 |
|
Back to Top |
|
2001 Estimated
Population By Sex |
|
Male |
49.24% |
|
Female |
50.76% |
|
2001 Estimated
Population By Marital Status |
|
Single Male |
13.89% |
|
Single Female |
10.79% |
|
Married |
58.49% |
|
Previously
Married Male |
5.48% |
|
Previously
Married Female |
11.35% |
|
2001 Estimated
Population - Households With Children |
|
Married Couple
Family |
76.48% |
|
Other Family -
Male Head |
4.05% |
|
Other Family -
Female Head |
18.54% |
|
Non Family |
.94% |
|
2001 Estimated
Population - Urban vs. Rural |
|
Urban |
78.11% |
|
Rural |
21.89% |
|
Back to Top |
|
Labor Force -
Madison County |
|
Calendar Year |
Civilian Force |
Employment |
Unemployment - % |
|
2001 |
147,880 |
142,900 |
4,980 - 3.4% |
|
2000 |
174,970 |
169,900 |
5,070 - 2.9% |
|
1999 |
172,050 |
166,280 |
5,740 - 3.3% |
|
1998 |
171,320 |
167,460 |
5,010 - 2.9% |
|
1997 |
141,980 |
137,790 |
4,190 - 2.9% |
|
1996 |
134,870 |
130,460 |
4,410 - 3.3% |
|
1995 |
133,310 |
126,920 |
6,390 - 4.8% |
|
1994 |
134,000 |
126,720 |
7,280 - 5.4% |
|
1993 |
134,000 |
126,290 |
7,710 - 5.8% |
|
Alabama
Department of Industrial Relations/Bureau of Labor Statistics 2002 |
|
2001 Labor
Force - Population over 16 by Occupation |
|
Executive and
Managerial |
14.37% |
|
Professional
Specialty |
22.21% |
|
Technical
Support |
5.80% |
|
Sales |
11.24% |
|
Administrative
Support |
14.22% |
|
Service:
Private Households |
0.44% |
|
Service:
Protective |
1.79% |
|
Service: Other |
8.66% |
|
Farming,
Forestry and Fishing |
1.11% |
|
Procision
Production and Craft |
9.94% |
|
Machine
Operator |
4.96% |
|
Transportation
and Material Moving |
2.63% |
|
Laborers |
2.64% |
|
Labor Force -
Wage Data - Comparative Annual Median Salaries |
|
Accountant |
$38,293 |
|
Computer
Operator |
24,939 |
|
Electrical
Engineer |
51,334 |
|
Machinist |
28,849 |
|
Executive
Secretary |
33,342 |
|
Sales
Representative |
33,093 |
|
Secretary |
26,312 |
|
2002
Huntsville/Madison County Wage Survey, 3-6 years experience |
|
Back to Top |
|
Labor Force -
Business Employment By Type - Hsv. Metro Area |
|
Type of Business |
# of Jobs |
% Workforce |
|
Manufacturing |
34,900 |
19% |
|
Durable Goods |
28,300 |
15% |
|
Non-Durable Goods |
6,500 |
3% |
|
Non-Manufacturing |
151,600 |
81% |
|
Construction/Mining |
7,100 |
4% |
|
Transportation/Utilities |
5,000 |
3% |
|
Trade |
38,300 |
21% |
|
Finance |
5,100 |
3% |
|
Services |
55,800 |
30% |
|
Government |
40,300 |
22% |
|
Total
Non-Agricultural Employment |
186,400 |
- |
|
Alabama
Department of Industrial Relations, 2002 Annual Averages |
|
2001 Labor
Force - Families By Number Of Workers |
|
No Workers |
9.16% |
|
One Workers |
28.25% |
|
Two Workers |
50.57% |
|
Three or more
Workers |
12.02% |
|
2001 Labor
Force - Population By Transportation To Work |
|
Drive Alone |
82.37% |
|
Car Pool |
12.53% |
|
Public
Transportation |
0.31% |
|
Drive by
Motorcycle |
0.15% |
|
Walked Only |
2.30% |
|
Other Means |
0.62% |
|
Worked at Home |
1.72% |
|
Back to Top |
|
Top 15
Employers - Huntsville/Madison County |
|
Employer |
Total |
|
U. S. Army,
Redstone Arsenal |
11,141 |
|
Huntsville
Hospital System |
4,355 |
|
Sanmina-SCI |
3,300 |
|
Huntsville
City Schools |
3,000 |
|
Daimler-Chrysler Corporation |
2,800 |
|
CINRAM |
2,800 |
|
NASA/Marshall
Space Flight Center |
2,754 |
|
Boeing |
2,700 |
|
City of
Huntsville |
2,186 |
|
Madison County
Schools |
1,936 |
|
Intergraph
Corporation |
1,736 |
|
ADTRAN |
1,731 |
|
Goodyear/Dunlop Tire Corporation |
1,660 |
|
Computer
Sciences Corporation |
1,600 |
|
Teledyne Brown
Engineering |
1,582 |
|
Chamber
of Commerce of Huntsville/Madison County - January 2002 |
|
2001
Households - Estimated Income |
|
$150,000 or
More |
3.49% |
|
$100,000 to
$149,999 |
8.24% |
|
$75,000 to
$99,999 |
11.39% |
|
$50,000 to
$74,999 |
21.13% |
|
$35,000 to
$49,000 |
17.27% |
|
$25,000 to
$34,999 |
11.98% |
|
$15,000 to
$24,999 |
12.65% |
|
$5,000 to
$14,999 |
10.09% |
|
Under $5,000 |
3.76% |
|
2001 Estimated
Average Household Income |
$57,276 |
|
2001 Estimated
Median Household Income |
$45,012 |
|
2001 Estimated
Per Capita Income |
$23,211 |
|
Back to Top |
|
2001
Households By Age By Poverty Status |
|
Above Poverty
Under Age 65 |
76.64% |
|
Above Poverty
Over Age 65 |
12.31% |
|
Below Poverty
Under Age 65 |
7.84% |
|
Below Poverty
Over Age 65 |
3.21% |
|
2001
Households - Occupied Units |
|
Owner Occupies |
65.11% |
|
Renter
Occupied |
34.89% |
|
1990 Average
Persons Per Household |
2.56 |
|
2001
Households - Owner Property Values |
|
Under $25,000 |
2.08% |
|
$25,000 to
$49,999 |
14.23% |
|
$50,000 to
$74,999 |
30.79% |
|
$75,000 to
$99,999 |
24.68% |
|
$100,000 to
$149,999 |
18.24% |
|
$150,000 to
$199,999 |
6.09% |
|
$200,000 to
$299,999 |
2.90% |
|
$300,000 to
$399,999 |
0.57% |
|
$400,000 to
$499,999 |
0.20% |
|
Over $500,000 |
0.22% |
|
Median
Property Value |
$77,934 |
|
Median Rent |
$332 |
|
2001 Education
- Population 25 and Over By Education Level |
|
Elementary
(0-8) |
7.57% |
|
Some High
School (9-11) |
12.19% |
|
High School
Graduate (12) |
23.06% |
|
Some College
(13-15) |
20.82% |
|
Associates
Degree Only |
6.23% |
|
Bachelors
Degree Only |
20.57% |
|
Graduate
Degree |
9.55% |
|
2001 Education
- Population Enrolled in School |
|
Public
Pre-Primary |
3.27% |
|
Private
Pre-Premary |
3.30% |
|
Public
Elementary/High School |
54.37% |
|
Private
Elementary/High School |
4.90% |
|
Enrolled in
College |
34.16% |
|
More than 70% of
people living in Madison County have a library card (the national
average is 30 to 40%). Only Denver, Colorado has a higher per capita
circulation statistic than Madison County. |
|
Back to Top |
|
|